find the winner.
brief the next one.
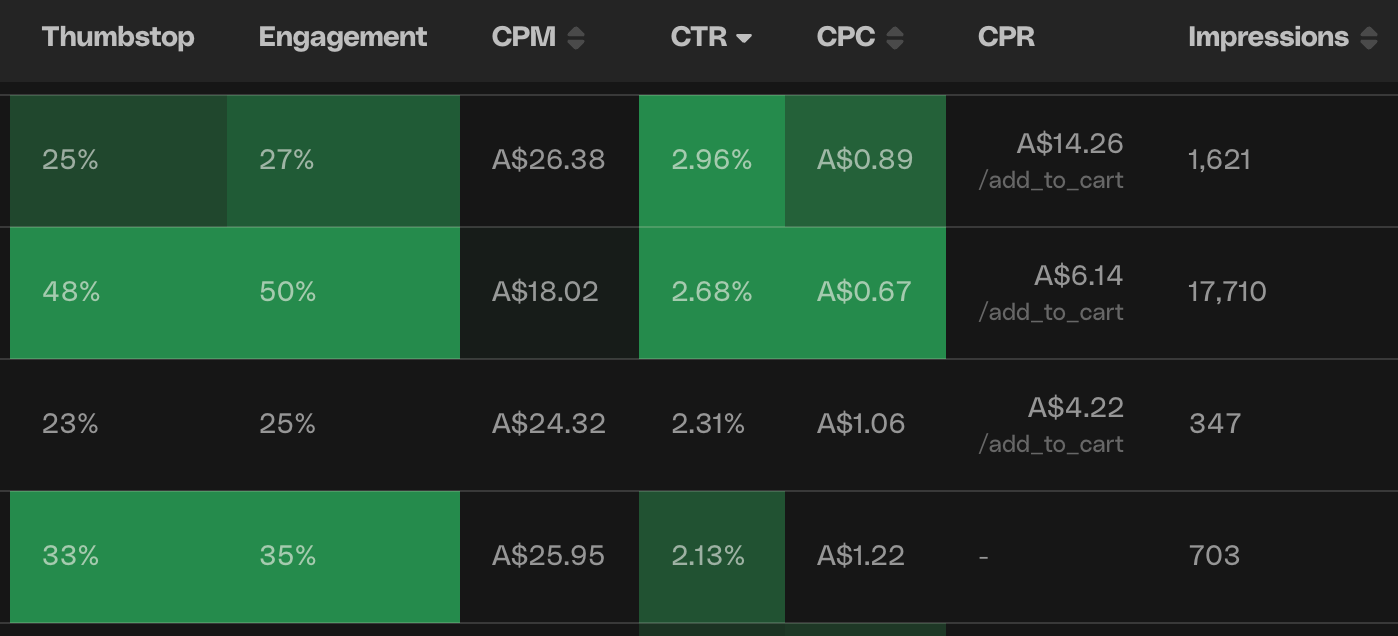
Ad Insights puts every Meta ad in one table, scored against targets you set. Winners light up. Then you hit Create Variations on the best row and the next brief starts there.
reporting tells you what happened.
this tells you what to make.
a dashboard is not a decision
Ads Manager tells you ad 14 outperformed ad 6. Then you're in a spreadsheet working out why, and by the time you have an answer the budget has already moved.
insight that becomes the next brief
One table, every Meta ad, measured against the numbers you decided matter. Spot the ad that's working, hit Create Variations, and Cuttable starts a new brief from it. The loop closes without leaving the tab.
real results from $30M monthly spend + 300 brands.
every meta metric.
your definition of a win.
the loop closes here
Ad Insights isn't a report you read at the end of the month. It's where the next brief starts.
set targets
Open the Heatmap control, choose Targets, and enter your numbers. Return on ad spend, click-through rate, cost per result, whichever ones you run the account on.
read the room
Ads that hit your targets are highlighted, everything else dims. Toggle on only show ads meeting every target and the table filters down to the ones clearing every bar.
make more of it
From any row, hit Create Variations. Cuttable reads what made that ad work, the hook, the angle, the offer, the look, and builds new ones to test off it.
what the numbers changed.
We can now move faster, test more, and focus on what is actually working instead of constantly rebuilding the creative.

hear from our customers
Teams who changed how they keep up with the volume and variety of ads it takes to perform on Meta.